- 金币:
-
- 奖励:
-
- 热心:
-
- 注册时间:
- 2006-7-3
|
|

楼主 |
发表于 2009-3-25 10:46
|
显示全部楼层
Tuesday, October 03, 2006Screening for High Dividend Yields WIth a Twist
I have been seeing a lot of differnt screens for high dividend yield stocks lately and while dividend investing is not a bad idea for a portion of a balanced portfolio, I believe that most of those screens are flawed. Here's how, they only take into consideration the amount of the dividend yield (keep in mind that you have to hold the stock for one year to receive all four, in most cases, dividend payments). A lot can happen to share price over the course of the year which is why I believe a better approach is to combine the dividiend yield with what stage the stock is in (see chart above, Stage 1- Accumulation, Stage 2- Markup, Stage 3- Distribution and Stage 4- Decline). To me it seems obvious that share price should be neutral (stage 1 or 3) at the least and even better, the stock should be in an uptrend (stage 2). Going even further, Stage 3 (Distribution) is typically followed by a stage 4 Decline which makes these stocks higher risk so these stocks may not make good purchase candidates.
I created a simple scan on the Profiler (see banner on right hand side) which first included all stages (1-4) on both a weekly and daily timeframe. I also put a price range of $10.00 to $200.00 Average daily volume (last 20 days) had to show a minimum of 500,000 and a maximum of 100 million shares. The list included Nasdaq, NYSE and AMEX stocks. PE was not considered and the stock had to have a dividend yield of at least 4%. This search yielded 82 stocks.
In order to cull this list further, I added a filter for PE ratio. The new list had all the criteria mentioned above and they had a PE ratio between 1 and 50, this cut the list down to 70 stocks.
Once again, I refined the search to disclude all stocks which were in a Stage 4 decline on either the daily or weekly timeframe, the list was further cut to just 53 stocks.
Still wanting the list to be shorter, I also eliminated stocks which were in a Stage 3 Distribution on either the daily or weekly timeframe, only 28 stocks remained.
This is the list of stocks which survived the successively stricter criteria. I have not reviewed any of these stocks and would not suggest that anyone buy them just because of a dividend. As always, you must do your own homework and decide if any of them are appropriate for your objectives and risk tolerance.
SAX AINV ACAS CSE CZN
HRP EPD O HCP PGN
TNE ED EAS TE CTCO
TLT NXL SO VZ SHY
WRI PKG XEL DUK BAC
UST CMA T
Posted by Brian at 10/03/2006 11:51:00 AM

Hard Landing or Soft Landing?
As a trader, it is just noise whether the economy has a "hard landing" or a "soft landing". My opinion is that the market is a leading indicator and that the worry warts have been missing out on one hell of a rally because their "economic models indicate....blah, blah, blah). Price is the only truth, it cannot be revised, adjusted seasonally or miscalculated. Price is TRUTH. See you after the close.
Posted by Brian at 9/29/2006 10:21:00 AM
Newer Posts Older Posts Home
Mid Cap Concerns
MDY- Weekly chart (click to enlarge)
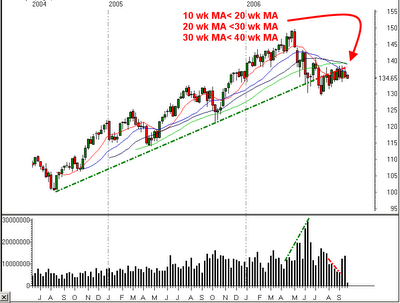
I have been warning of potential trouble for the S&P 400 Mid-cap index ETF (MDY) in my videos over the last month or so and now the index appears to be on the verge of breaking down. If this index (which led the market higher) does break lower, there could be severe negative consequences for the overall market. This index represents the biggest threat to the overall health of the market right now and you should keep a close eye on it here. The weekly chart shown above shows the index has had a negative volume pattern since it began its decline in early May. As the index drops, the volume has been increasing. While the index has rallied over the last 8 weeks, the volume has been diminishing, which means the buyers lack conviction. Even more recently is the increased volume of the last 2 weeks as the market churned below all of the longer term moving averages. Big volume without further upside equals distribution. If buyers do not come in and rescue this index this week, there could be a quick and severe selloff that follows, be careful....
MDY daily chart
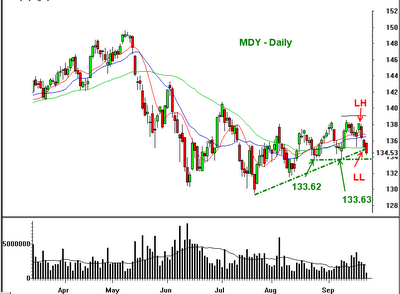
The uptrend line on the daily timeframe has been broken and the index has made a lower high and a lower low, but that is only enough to get me into the "extremely cautious" camp. In order for me to become outright negative and convinced of a real selloff materializing, it would take a move (close) below the recent lows at 133.62, 133.63. Closing below that support level would get me very concerned that a longer term selloff has begun. This is a good time to be very careful. Short term, I think we can breath a little bit easier if the MDY can close above 136.50.
Posted by Brian at 9/25/2006 10:30:00 AM
Sunday, September 24, 2006How 'bout them Rams!
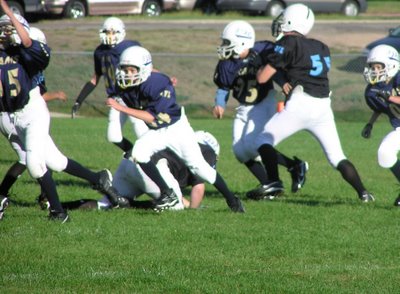
No, not the professional team. My son's senior recreational league who won another game yesterday and are now 4-0 with a combined score of 164-0! They DOMINATE! It cost me another $15.00 too. For every sack that Matthew makes by himself I pay him $10 and for participating in a sack it's 5 bucks. It's cool to see my son standing out on an excellent team. The coach is a funny guy, one of the things he says is "we don't punt, we make other teams punt!". I don't think the team even has a punter. On the opening drive yesterday, the Rams got backed up to their own 15 yard line and it was fourth and 20, guess what they did? They went for it, and it worked! In fact they scored a TD on the play. If I was the coach, I would have punted. I guess that is why I am a trader and not a football coach :-)
Posted by Brian at 9/24/2006 12:10:00 PM
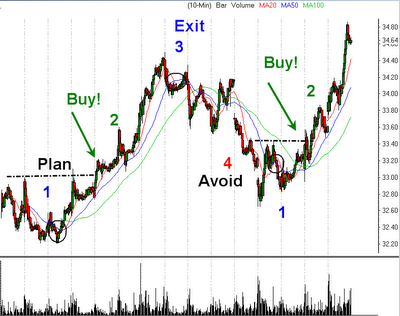
When initially entering the trade, the first technical consideration is the location and price levels of support and resistance. Besides making sure we are entering a position that is not too far extended from a decent level of support, the reason we immediately look for support and resistance is to set a protective stop. We place the initial stop to make sure that if the stock does not act the way we expected it to, our accounts are not exposed to a catastrophic loss. For longs, stops should be placed just below the most recent support, and for shorts stops should be placed just above a recent resistance level. Obviously, if it is not a swing trade, a shorter timeframe should be utilized to determine this protective level. In the case of ODSY, the stock was shown after it broke out to all time highs on May 6, with the price at the time $17.60 (adjusted for a 3/2 split on August 12). At that time, the highest preceding low was found at the April 30- low of $15.73, coinciding with the location of the rising 50 day moving average. Whenever we have more than one technical reason for being involved in a trade it adds significance to the level. In this case we had what appeared to be the beginnings of a new uptrend with the prior low and the rising 50 day moving average in the same location. Just below the prior higher low is often the ideal point to place our initial stop because breaking below that level would nullify the trend. In essence, we are exploiting the definition of an uptrend (higher highs and higher lows) to remove the dangerous emotions to be allowed to enter our decision making process.
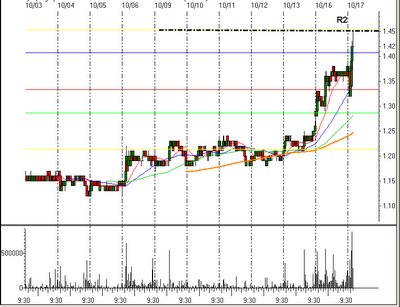
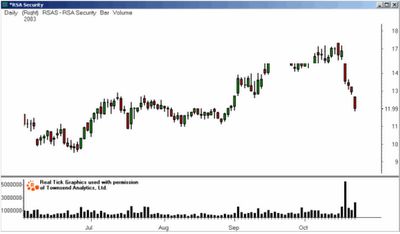
Gaps against the prevailing trend occur when a stock in an up trend suddenly gaps lower while you have a long position in the stock. Luckily, these gaps in trading caused by an imbalance to the sell side while the stock is in a solid up trend are not that common. We are not discussing common gaps of 1-2% here, but a gap down by more than 5%. When we do find ourselves in the unfortunate situation of being caught in this predicament, it is often best to sell the entire position. A gap of this magnitude (5% or move) will not typically occur unless there is a serious fundamental development at the company, and since our entry may not have taken fundamentals into consideration, we are now in a position that we were not anticipating. As they say, “When in doubt, get out!” As a general rule of thumb for gaps, liquidate the position if a hard stop (sell event number 4) has been violated. If the stock gaps down 5% but does not violate a hard stop, we need to monitor the stock closely for further signs of weakness. If it looks like liquidity may be an issue for exiting a larger position, it is a good idea to consider selling half of the position so if the weakness continues you will not feel trapped in the stock as it declines and grow reluctant to sell, waiting for a bounce that may never arrive.
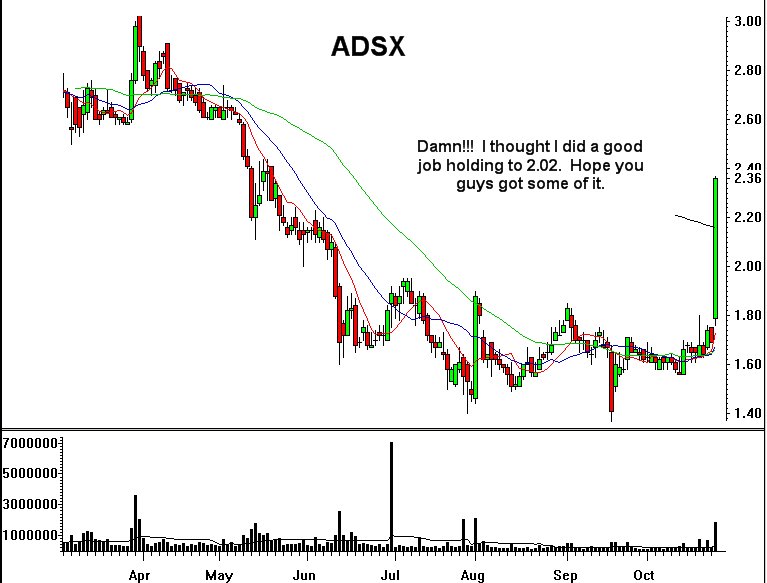
We can see in the chart of RSA Security that the stock gapped lower on October 17 and did not bounce. Although it would have been a tough decision to liquidate the position on such a gap, it is clearly better to have sold at the first sign of trouble than it would have been to continue to hold and hope. Sometimes it is best to get the pain over all at once by selling the entire position rather than prolonging the agony of a loser, similar to removing a band aid from a wound, as slowly peeling a band aid only extends the discomfort.
Price Targets. It is a good idea to have a reasonable expectation as to where you think the stock has the potential to rally to; thus coming up with an estimated area where selling may occur. If our stock is in a solid uptrend that may be approaching a prior level of support, there is the potential for that past area of buying to offer resistance. Assuming you started with a good theoretical risk/reward ratio in your original purchase, taking some of the profits makes sense at the target area. But also be careful not to sell too much of a stock that continues to have strong upward momentum because the biggest gains are likely to still be ahead in this situation. Selling a little at the target also helps make it easier to let go of the stock later because it shows we are not emotionally attached to the stock, and you’ve got to admit it feels good to take a profit and reward yourself a little. Taking a little stock off the position also reduces our overall risk and gives us a little cushion in case something unexpected happens to make the stock drop suddenly. For the rest of the position, hold on tight, and allow yourself to have a big winner. Bulls and Bears make money, Greedy pigs get slaughtered and Disciplined pigs get Rich!
Hard trailing stops require the most skill, but by the time we get to this point, the stock is doing the work while our job is to monitor and adjust our risk levels as the stock moves higher. A hard trailing stop is based on the very definition of the trends we are trying to take money from. As we know, the definition of an uptrend is “a series of higher highs and higher lows.” This implies that breaking the series of higher lows is a violation of the trend and that is a reason to sell. When looking at a chart that encompasses 17 days of trading utilizing 15 minute time increments, we can see how shares of Netflix Inc. (NFLX) ascended over the course of nine days in a perfect stair-step pattern of higher highs and higher lows. Assuming the purchase of the stock at $36.50 on October 2nd, we would have an unrealized profit of $4.41 per share based on the close at $40.91, and this is a gain that is definitely worth protecting. The accompanying chart of NFLX shows how the trader would have raised the stop up under the rising lows with an exit being made on October 8th as the stock traded below the prior low of $42.85. This stop would have allowed the trader to lock in a gain of $6.35 over the course of five trading days. This stop takes some work because you have to cancel and replace orders, but this is work that is fun because it means you are locking in profits. In order to capture the occasional windfall profits in a stock that exceeds the profit objectives, we use a simple methodology that has proven very effective for holding stocks that are showing positive momentum. The method for allowing our winners to run is to use a trailing stop-loss based on the higher lows that the stock is forming in the uptrend. Holding a long stock that is moving higher is done by using the daily chart and placing our stop just below the level of the last higher low. If the stock does not trade below the previous days low then it is showing positive momentum and should be held overnight again.
RealTick® Trailing Stops are my favorite stops to use on a day trade. This unique stop actually gives control of your order to the algorithm built into the RealTick trading platform. The ideal situation to use a trailing stop is when you buy a stock that finds rapid upside velocity, pushing the stock quickly away from your hard stop. In the situation where the stock may run $1.00 or more in just a few minutes we are faced with the dilemma of deciding whether to sell the position and lock in the gains or to allow it to run further. We’ve all seen the stocks that can run 2-3 dollars in the course of an hour or less, and we certainly don’t want to allow a nice winner turn into a loser. The emotions that can be dredged up from this experience tempt event the most disciplined traders to exit with the profit rather than allowing it to run further. These stops are going to be utilized most often within the first hour of trading, when emotions from the amateur buyers are often at an extreme. Fortunately, technology has taken given us the opportunity to mitigate the emotional decision process with the Real Tick trailing stop.
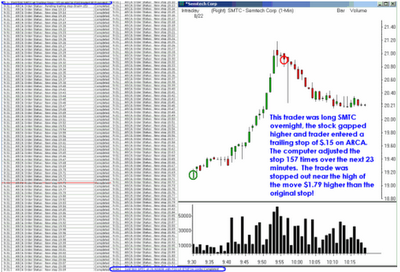
This stop works in the following way, we will refer to chart four here. On August 21 Semtech started to rally late in the afternoon and I bought 1000 shares for a quick day trade. The stock continued to progress nicely higher, and because it was showing strong positive momentum and displayed a strong technical pattern, I locked in partial profits on half of the position and allowed the rest day to be transitioned into an overnight hold. The stock closed that day at 18.58. The next morning the stock gapped higher at 19.11, and at this point I was tempted to sell the stock for a quick profit of $265, but decided instead to allow the profits to run a little. When the stock was at a price of $19.28 I entered a trailing stop of $.15, which is read on the Archipelago Exchange as a stop market order at 19.13. As the stock exhibited further strength the stop automatically gets adjusted higher, but it will never get adjusted lower. The trailing stop sets an actual stop $.15 (or whatever increment you choose) below every new high the stock makes. Keep in mind that this will turn into a market order upon the stop getting activated and this can cause slippage in illiquid or fast moving markets. As you can see from the accompanying table and the chart, over the next 23 minutes the stop was automatically adjusted 157 times until the trade was finally stopped out $1.79 higher than the original stop. That is an extra $895.00 made on the trade without any further intervention on my part, and a total profit for the day of $1160.00, and to think that I was tempted to sell at the open for just $265.00! Ideally I would love to use a trailing stop on all my trades because it means I have gotten into a stock at a time of maximum upside velocity.
The most difficult decision for a trailing stop is how much room to allow the stock to have. I think it is sort of like going fishing. If you have a big fish on and you tighten the line too much the fish is sure to break off and you never get to taste your reward. In trading, if you set the stop too tight you might get shaken out of the position before the stock runs its course. How much room I decide to give a trailing stop depends a lot on historical volatility and the price of the stock. The more volatile and higher priced stocks will need to be given extra room to wiggle while less volatile lower priced issues can usually be kept on a tight leash with just a $.10-.15 stop.
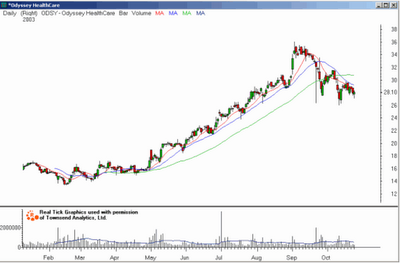
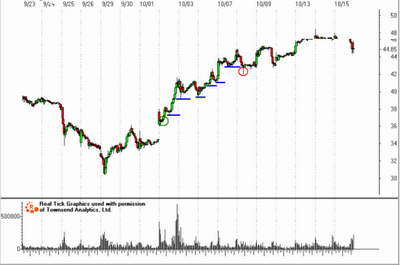
Moving Average Crossovers often signal the end of a prevailing trend and that is a good time to take profits on a position. For this example we will refer to the chart (3) of Odyssey HealthCare (ODSY). Referring to the July article, the stock was purchased in early May near $17.50 (adjusted for a 3/2 stock split on August 12) with the hope the market would allow it to be a position trade because of all the positives the stock had, position trades typically last from a week to as long as six months.
Trending stocks tend to stay above the rising moving averages, and ODSY remained in a healthy up trend that would pause briefly at the 10 and 20 day moving averages where it would find fresh buyers to bring the stock higher. On September 22, the stock broke hard down to the rising 50 day moving average. This swift sell off was reason for concern, but not yet a reason to sell as stocks often find support at the rising 50 day MA. Three days later, the stock experienced another wave of selling and that brought the 10 day MA down through the 20 day MA, this action tells us that the short term trend was now heading lower while the intermediate term was trending higher, this indecision tells us it is time to book profits. The stock was at $28.50, well off the high near $36, but still 62% higher than the purchase just four months before. That is how this type of stop can get us out of a position, now let’s examine why.
Moving averages are simple, but often misunderstood, technical indicators. I like moving averages because they allow me to objectively identify trends on all timeframes with incredible accuracy. One of the common misconceptions about MA’s is that moving average crossovers are a reason to enter a position, I have found that moving average crossovers occur in a sideways consolidating market and it is difficult to determine when these consolidation periods will end. Understanding that moving average crossovers represent indecision because there is no longer a consensus of agreement about whether buyers are sellers are in control allows us to recognize the value of the first crossover at the end of a trend as a reason to sell. Usually a moving average crossover occurs after a trend has exhausted itself, and as trend followers there should be no clearer sign that it is time to exit gracefully with our profits before the market relieves us of them.
Time Stops are a way of exiting a position that is stagnant. As traders, we encounter two forms of risk, the previous six reasons to sell addressed the risk of price. This stop addresses our other form of market risk, time. Time can be our biggest enemy in a trade; it can be the quiet killer of our equity. How many times have you neglected a stock in your account because it wasn’t doing anything? Even a day trader will sometimes find himself complacent with a stock that doesn’t show any movement, and then suddenly a sell order comes into the stock and moves it lower by a dollar without us having the ability to react. The time stop takes care of getting out of a position if it is not working as quickly as we would have expected. The general guidelines that I use as time stops for day trades is 15-30 minutes, with more emphasis on 30 minute level if the overall market is moving in the direction anticipated for the stock. For a swing trade, I will typically give the stock 2-3 hours before moving before I consider selling the position out near my cost basis. For position trades, my patience gets stretched easily and I will give the stock no more than 1-2 days to get moving before I start to think my timing is off. When I get stopped out because of time, I will often re-enter the stock if it exhibits signs that it may be ready to move later on.
These seven reasons to sell are not meant to be the only reasons to exit a position, but hopefully it does give you something to think about when you look at closing out your positions. Keep in mind that the there are many different situations that present themselves to us in the markets and the more strategies we have to take advantage of them, the more likely we are to attain our goals being in the elite group of who consistently take money from the market.
Posted by Brian at 9/16/2006 12:52:00 PM
Newer Posts Older Posts Home |
|
|
 [复制链接]


 One pro's view of the stock market. Stock screens, market analysis, trading tools, stock research, investment ideas, portfolio analysis, trading lessons, investment commentary, trading tips, and more are provided by Charles E. Kirk.